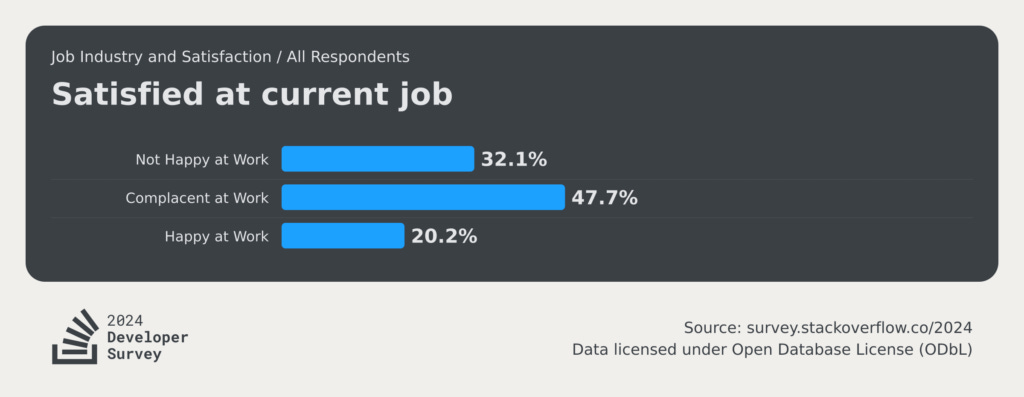
💡Only 20% of Developers are Happy at Work?
Within Meta, we conduct a bi-annual survey called Pulse. It's our internal tool for gathering employee feedback about their experiences, focusing on three key dimensions: Manager, Company, and Personal Experience. The survey helps us measure employee and developer happiness, signal team health, and guide our leaders in improving Meta's work environment.
The recently released Stack Overflow 2024 Developer Survey provides a fascinating broader perspective that complements our internal insights. Let's break down the key findings that every tech leader and engineer should know.
Several factors contribute to this widespread unhappiness:
-
Technical Debt: 62% of developers cite technical debt as a primary source of frustration, indicating that working with outdated or inefficient codebases hampers their productivity and morale. [Stack Overflow Blog]
-
Salary Declines: Many developers have experienced salary reductions over the past year. For instance, the median salary for PHP developers has decreased to $49,000 annually, reflecting broader economic challenges within the tech industry. [Shift Magazine]
-
Workplace Pressures: High-pressure environments, characterized by tight deadlines and excessive workloads, contribute to burnout and job dissatisfaction among developers. [Shift Magazine]
The survey also highlights some fascinating trends:
-
Flexibility > Salary: Developers continue to value workplace flexibility even more than compensation.
-
Role-Specific Joy: Engineering managers find fulfilment in driving strategy, while embedded developers love improving hardware quality.
Join Me
Read more about Engineering Culture in MAANG (Big Tech), ⚡Newsletter, Twitter and LinkedIn for more Career, Leadership and Growth advice.
📊 Only 1 in 5 Individual Contributors are happy at work
Individual Contributors
-
19.3% are Happy at Work
-
47.7% are Complacent
-
33% are Unhappy
People Managers
-
25.9% are Happy at Work
-
47.8% are Complacent
-
26.3% are Unhappy

Across both groups, complacency is alarmingly high, and genuine job satisfaction remains rare. Although people managers report slightly higher happiness levels, these figures reveal systemic workplace culture, expectations, and support issues.
What factors contribute to this dissatisfaction?
📌 Technical debt and outdated processes
📌 Burnout from high-pressure environments
📌 Limited career growth or unclear advancement paths
📌 Misalignment between developers' values and organizational goals
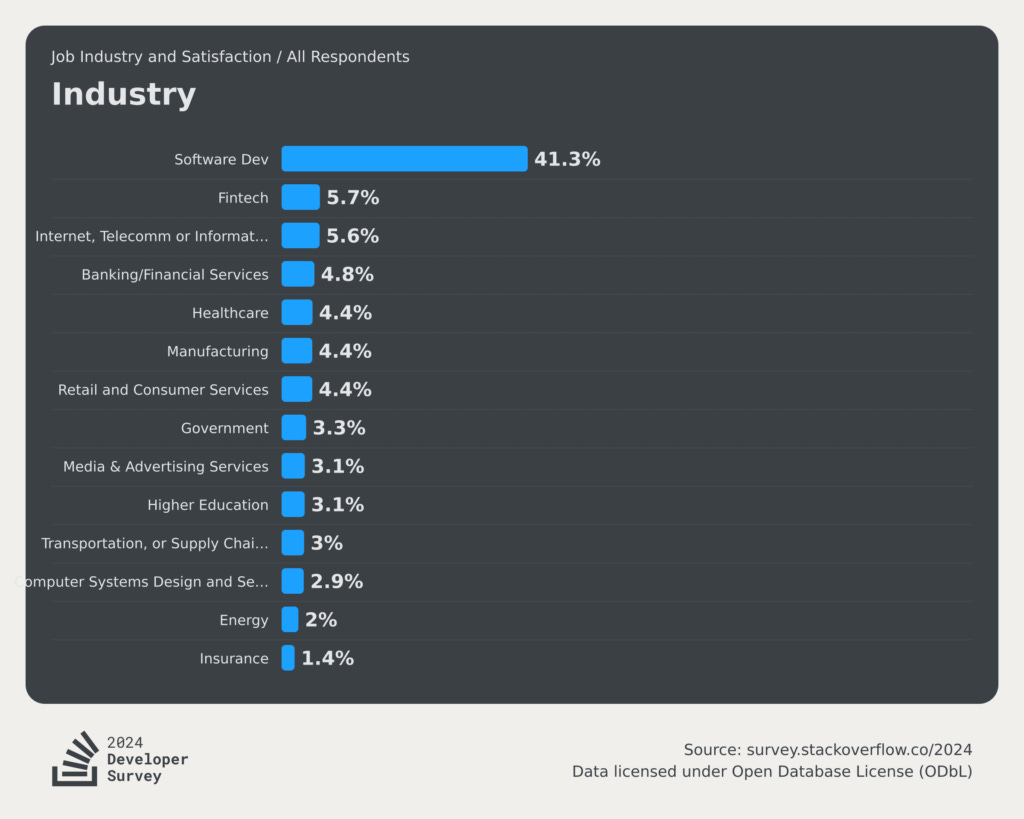
📊 Top Industries by Developer Employment
-
Software Development: 41.3% 💻
-
Fintech: 5.7% 💳
-
Internet/Telecom: 5.6% 🌐
-
Banking/Financial Services: 4.8% 🏦
-
Healthcare: 4.4% ⚕️
-
Manufacturing: 4.4% 🏭
-
Retail & Consumer Services: 4.4% 🛍️

What does this tell us?
📌 The Traditional-Digital Divide: While pure software companies still dominate, nearly 60% of developers work in traditional industries that have transformed into tech companies. This trend reinforces the idea that every company is becoming a tech company.
📌 Financial Sector's Influence: Fintech and Traditional Banking employ over 10% of developers. Throughout my career working with financial institutions, I've witnessed their evolution from tech consumers to innovators.
📌 Essential Services Transformation: Healthcare, Manufacturing, and Retail each claim 4.4% of the developer workforce---highlighting how digital transformation reshapes core industries. These sectors have progressed beyond merely adopting technology; they're now driving innovation.
📊 Factors Contributing to job satisfaction
Happy points
-
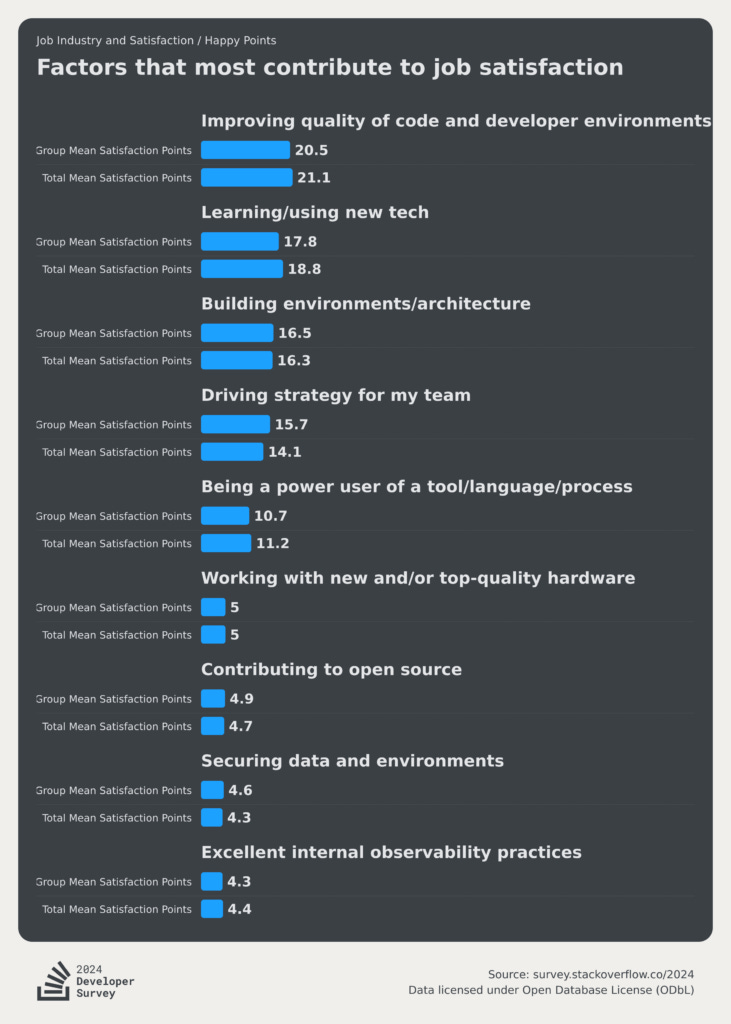
Top factor: "Improving quality of code and developer environments" leads, with a group mean satisfaction of 20.5 and total mean satisfaction of 21.1.
-
Second-highest factor: "Learning/using new tech" scores 17.8 group mean and 18.8 total mean satisfaction.
-
Building environments/architecture ranks third, at 16.5 (group) and 16.3 (total).
-
Driving strategy for my team scores 15.7 (group) and 14.1 (total).
-
Lowest factors: "Securing data," "Observability," and "Open Source" remain under 5 points, showing limited impact on satisfaction.

Unhappy points
-
Improving quality of code and developer environments is also the top factor for dissatisfied developers, scoring 21.3 (group mean) and 21.1 (total)---highlighting its universal importance.
-
Learning/using new tech is next, with 19.4 (group) and 18.8 (total).
-
Building environments/architecture maintains relevance at 16 (group) and 16.3 (total).
-
Driving strategy for my team is less prioritized among unhappy developers (12.7 group mean), while other areas like "being a power user" and "working with new hardware" score higher.

Key Takeaways
📌 Universal importance: Both happy and unhappy developers strongly prioritize "Improving code quality" and "Learning new tech."
📌 Role-specific differences: Happy developers score "Driving strategy for my team" higher than unhappy ones, indicating this factor's unique motivational impact.
📌 Underestimated factors: Contributions to open source and securing environments, while less impactful overall, might serve as niche drivers for specific developer groups.
📌 Strategic alignment: Opportunities to improve code and explore new technology are vital to boosting satisfaction universally.
The Role of Salary in Satisfaction
Salary remains critical in job satisfaction, but its impact varies significantly by country and context. As Erin Yepis from the Stack Overflow team explained in the "Dev Interrupted" podcast:
"I looked at the top 10 countries that responded to the developer survey. Most happy developers are definitely above the 50th salary percentile, but the relationship between salary and satisfaction is stronger in some countries than others. For example, job satisfaction scores stayed consistent in the Netherlands regardless of salary. However, developers in Brazil or France were more swayed by higher salaries." -- Erin Yepis
This highlights how context matters. Developers' satisfaction may be less tied to income in countries with more robust social safety nets or more balanced work cultures.
Why Satisfaction Matters for Leaders
As a leader, these insights hit home. Whether you're managing a team of engineers or leading at the senior leadership (CxO, VP) level, this data is a call to action:
-
Invest in your team's growth: Developers value learning opportunities and using new technology. Providing these opportunities keeps teams engaged and excited.
-
Focus on impact: Improving code quality and enabling developers to build meaningful solutions drives satisfaction at all levels.
-
Recognize role-specific motivations: Engineering Managers derive joy from driving strategy, while embedded developers thrive on high-quality hardware. Understanding these nuances helps create tailored environments for success.
-
Foster flexibility: Post-COVID, flexibility remains more important than ever. Hybrid and remote working options consistently rank as top motivators, even above salary in many cases.
Join Me
Read more about Engineering Culture in MAANG (Big Tech), ⚡Newsletter, Twitter and LinkedIn for more Career, Leadership and Growth advice.
💬 Your turn
-
What drives satisfaction in your role?
-
What strategies have helped you create happier, more engaged teams if you're a leader?
-
Let's start a conversation and learn from each other.
P.S. If you're interested in shaping Meta's engineering culture, feel free to DM me.
[Data: Stack Overflow Developer Survey 2024]
